
Child Impact dashboard supports the 2026 assessment framework, reporting partner project results with measurable, comparable standard indicators
Child Impact has updated its dashboard and project pages to show partner project outcomes using Bureau 4’s standard indicators, processed by the evaluation team. This makes it possible to see how children and families have changed, using the same set of figures across the network.
Translated from Thai by AI
From figures for each area to a shared language of outcomes
Child Impact brings together data on projects run by partners working with children and families. Until now, partners entered their own results in the system, counting how many children were at a low, moderate or high level before and after activities in each area. This made it quick to see the overall picture, but comparing results between projects was difficult because each area used its own levels and reporting format.
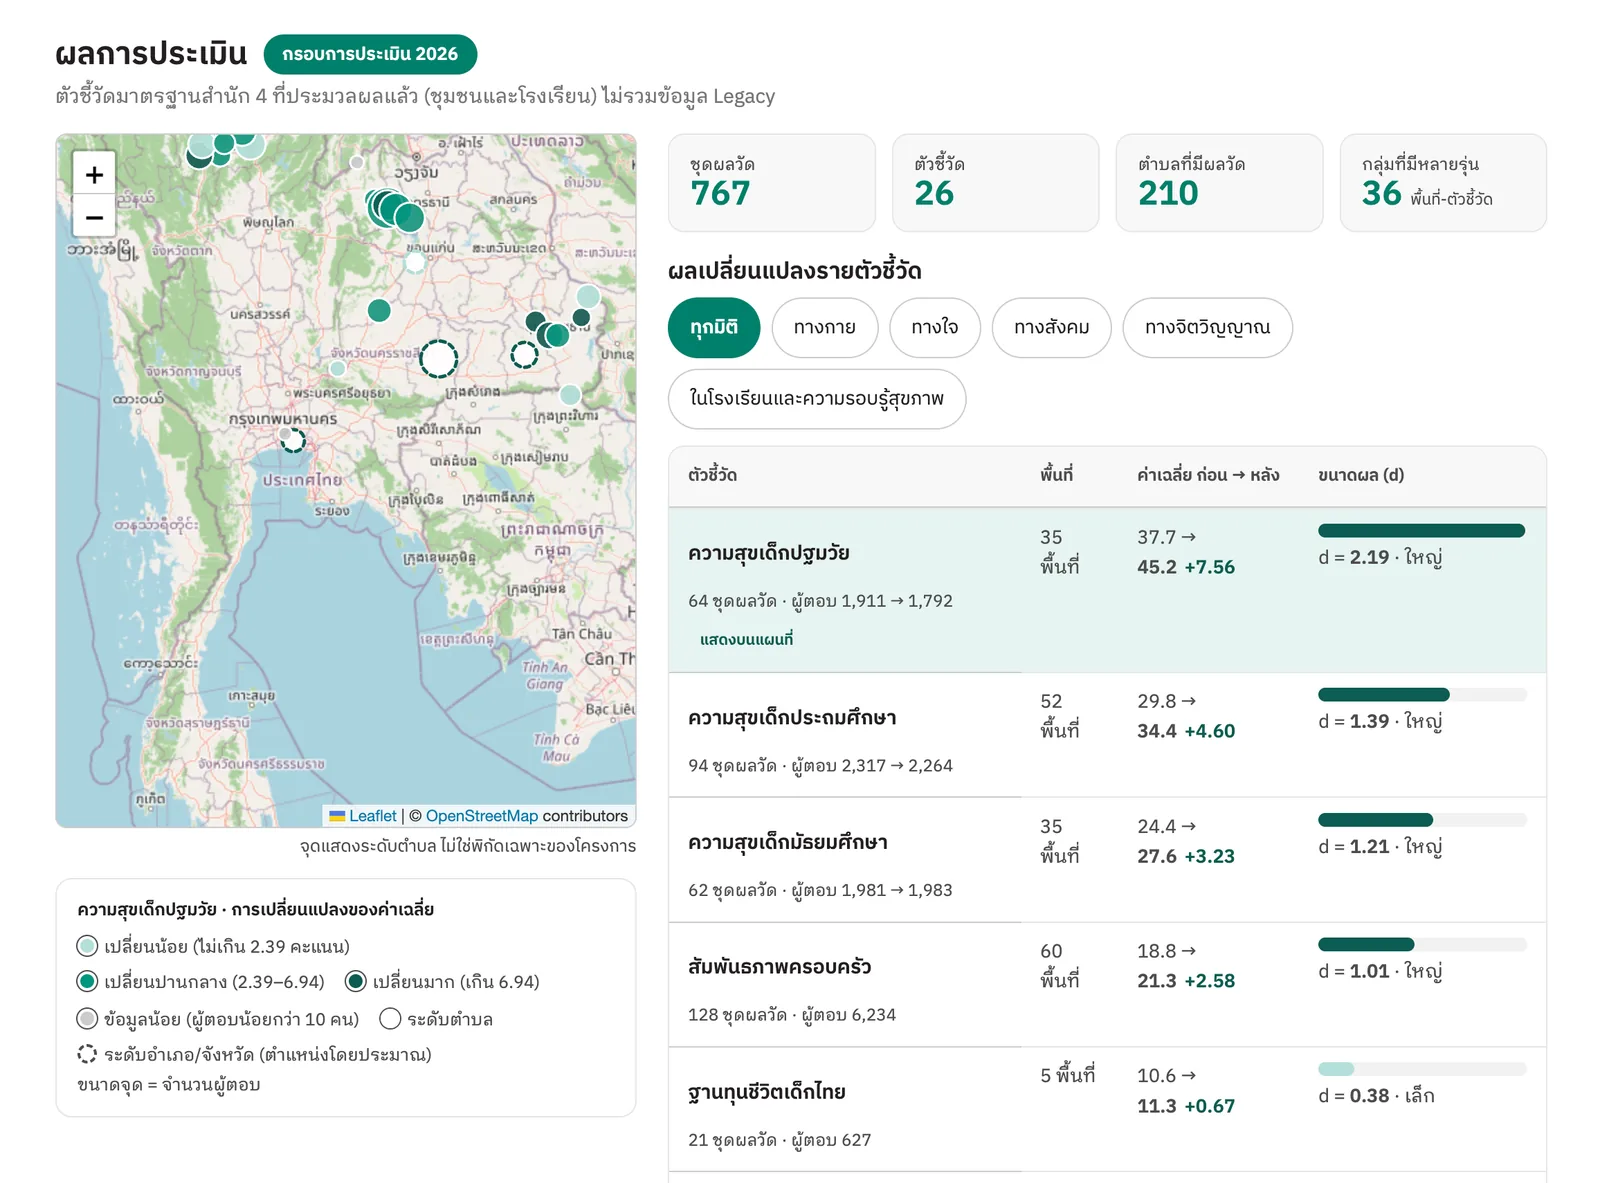
In 2026, Bureau 4 established a new primary method for reporting outcomes. Partners report scores against Bureau 4’s standard indicators. The evaluation team processes them and standardises them, and ChangeFusion then brings the results into Child Impact. Each set of results clearly shows how many respondents were measured, the average scores before and after, and the statistical significance of the change.
Calling each measurement method an “assessment framework”
Both methods use the same set of Bureau 4 standard indicators; they differ in how results are reported and the format of the data. The dashboard therefore separates them into two frameworks for users to choose from.
- 2026 assessment framework is the current primary method and the page’s default. It shows the number of respondents, average, standard deviation (SD) and p-value processed by the evaluation team.
- Legacy assessment framework is the previous method. It shows the number of children at low, moderate and high levels before and after in each area. These figures are retained exactly as they were.
When a framework is selected, all figures, charts and maps related to outcomes change to match that framework. The system does not combine figures from the two frameworks, to avoid presenting a misleading picture. Data that does not depend on the measurement method, such as the number of projects, beneficiaries, areas of operation and child development screening results (DSPM), is shown once across all frameworks.
What users will see
- Overview dashboard has an assessment framework switcher at the top, along with a map, an indicator table and the magnitude of change for each indicator. The province, issue, funding source, year, area type and project filters remain available, and users can share a link to their selected view so others can open the same view.
- Project pages show areas and beneficiaries first, then separate outcomes into tabs by framework. In the 2026 framework, users can see each area’s before-and-after scores side by side, along with the number of respondents and effect size. The Legacy framework shows the proportions of children at each level, as users are familiar with.
- Faithful to the data: every result is labelled with the number of respondents. Warnings appear when data is sparse or should be checked. Approximate coordinates are identified, and users are told when p-values come from the evaluation team’s source files.
- All projects remain in the list, whether or not they have data in either framework, with a label showing which framework data each project has.
- Works on mobile and has been adjusted to be easy to read for all user groups.
Benefits for partners and the network
This assessment framework enables partners’ work to be communicated using a single, genuinely measurable standard. Partners can see their project results using the same indicators as others in the network. Supporters and the public can understand the extent to which children and families have changed, and compare results across areas or projects with supporting evidence. At the same time, data that partners reported using the previous method remains fully accessible and is not lost as a result of the change in method.
The system is also designed to allow new assessment frameworks to be added in the future without rebuilding the existing pages, should the network adopt additional outcome measurement methods.